We all know how vital quality control (QC) is for our samples. A lot of research has gone into developing useful QC metrics for genomics experiments - primarily due to their high cost. Skipping this step will waste both time and money.
There are three main areas where QC can be applied to next-generation sequencing (NGS)
- On the starting nucleic acid samples
- After library preparation
- Post-sequencing
Ultimately the best QC of your NGS experiments is likely to come from the sequence data and, because of this, many labs will run a QC lane first.
NGS QC metrics
- Sample quality control
Usually you would start an NGS experiment with high-quality DNA and/or RNA samples. However, many experiments are performed with degraded nucleic acids. Often you rely on spectrophotometric (Nanodrop), fluorimetric (Qubit, PicoGreen or RiboGreen assay) and gel electrophoretic methods (Bioanalyzer) to QC starting material. Agilent's RNA Integrity Number (RIN) provides a robust and non-subjective method for RNA QC, with most experiments using samples with RIN>7. - Library quality control
Before sequencing most NGS libraries are checked on the Bioanalyzer. This verifies the insert size is as expected and that there are no contaminating adapter-dimers. These can be a major issue with exclusion-amplification clustering chemistry for Illumina platforms. - Sequencing quality control
There are several commonly used sequencing QC metrics. Sequence analysis viewer (SAV) and FastQC analysis reports for each sequencing lane. - Sequence analysis viewer (SAV)
SAV is an Illumina tool used to monitor sequencing during, or check QC after a run (Illumina's SAV user guide).
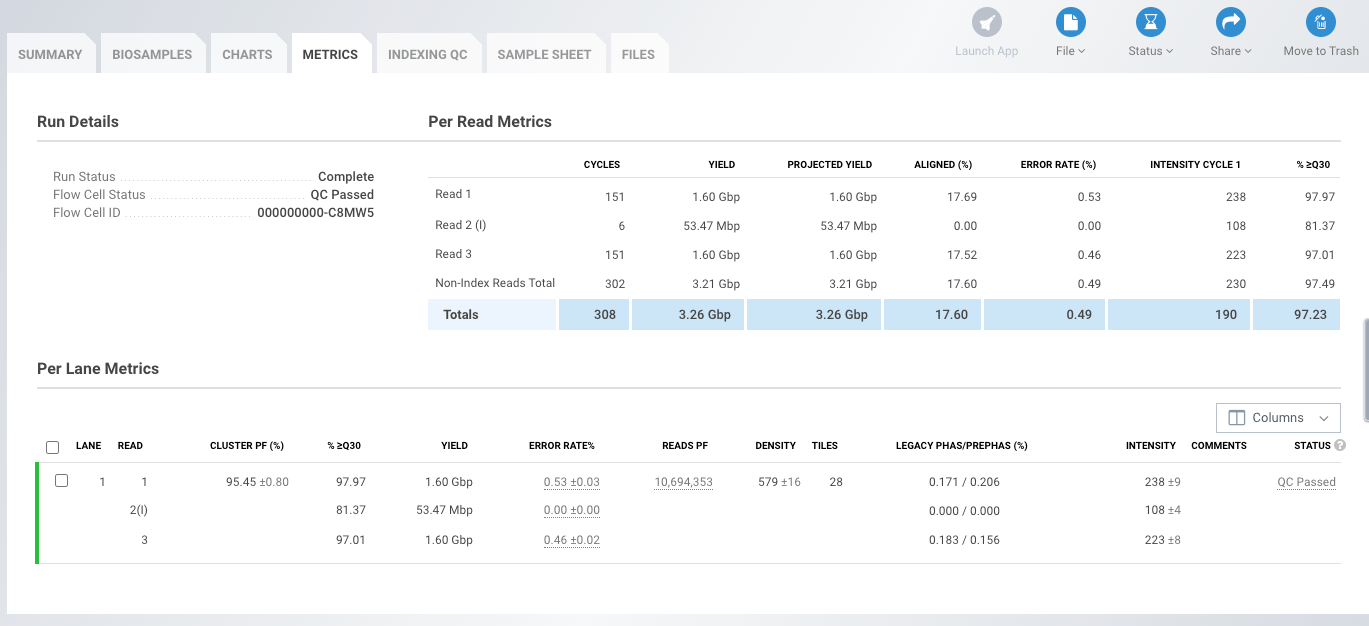
Illumina's BaseSpace also contains useful data presented in the "Per Read and Per Lane Metrics" tables. These include yield, error rate, %>=Q30, Density (K/mm2), Cluster PF(%) and Phas/Prephas (%) (Fig1). - Yield
Yield is the number of bases generated in the run. Yield is important to all users, but is usually something your service provider will guarantee so you don't need to worry about it. - Error rate
Refers to the percentage of bases called incorrectly at any one cycle. It is calculated from the reads that are aligned to Illumina's PhiX control. If this was not used then %>=Q30 is your best tool to check base quality. Error rate increases along the length of the read. - %Q30
The percentage of bases with a quality score of 30 or higher, respectively (see "Quality Scores Explained" below). Most Illumina runs will generate >70-80% Q30 data. This value is an average across the whole read length, and error rate increases towards the end of the reads. Because of this a run can "fail" at the end of a long-read, but pass Illumina's specs for the run with respect to Q30 - if a read is Q40 for bases 1-100, and Q10 for bases 101-150 it will pass the Q30 spec, but if you need the ends of the reads to be high quality, you may be disappointed. - Density (K/mm2)
The density of clusters on the flow cell (in thousands per mm2). On MiniSeq, MiSeq, NextSeq and HiSeq 2500 this is an important metric to evaluate if the data are low-quality. It should be assessed in tandem with %PF as the two together can diagnose problems with over- or under-loading your library. On HiSeq 4000 and X density is a fixed value and diagnosing issues with library loading are much more difficult to fix. - Cluster PF (%)
In Illumina clustering a single-molecule should generate a single cluster with a clear signal in the base being sequenced. The %PF is the number of clusters that passed Illumina's "Chastity filter". The clusters that do not pass this filter are generally removed from downstream analysis.
The Chastity filter works by calculating the ratio of the highest base intensity to the sum of the 1st and 2nd highest, anything less than 0.6 is filtered out. If a cluster was formed from a single-molecule then the chastity score will be 1; if it were formed from two molecules the signal would be equal and the chastity score will be 0.5. - Phas/Prephas (%)
This is an important metric to pay attention to - low numbers are what you want to see e.g. 0.1/0.1. Phasing is the rate at which individual molecules in a cluster become out of sync with each other, with some falling behind (phasing), and others jumping ahead (pre-phasing). The value given is the percentage of true signal being lost in each cycle, so after 150 cycles 15% of the data is now noise. Phasing is why long-reads are difficult!
There are several possible causes for poor phasing/pre-phasing, but to estimate this correctly requires a sample with balanced base-composition (25% of each base), if you know your sample to be unbalanced then you may need to add extra PhiX control. Assuming your sample is not the problem the most likely causes are the reagents or flow cell. Check the use-by date of reagents, check that there were no problems with fluidics, and check that the temperature was not too high during the run. - Sequencing reads
If you are performing read-counting applications such as RNA-seq or ChIP-seq then this metric is likely to be more important than yield. The two can be used interchangeably by sequencing service providers, so make sure you know which is most important to you
Analysis of NGS quality scores
"A quality score is an estimate of the probability of that base being called wrongly q = -10 x log10(p)"
FastQC Is a very commonly used NGS QC package that is applied before primary biological analysis (FastQC). It reports multiple QC metrics, which are reported with a traffic light warning system, normal (green), abnormal (orange) or bad (red), making it relatively easy to interpret results. These can be used to quickly identify common problems with NGS data and QC individual sequencing runs before starting biological analysis.
The most useful plots for most users are:
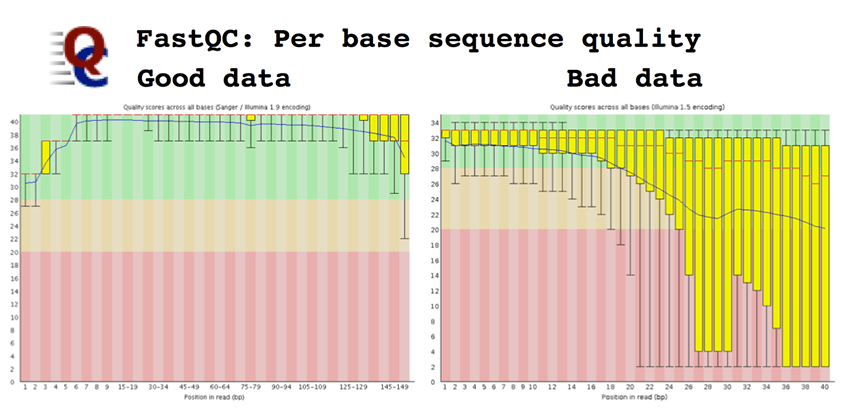
Per base sequence quality, which plots the Q-score of the raw sequence reads as a box-plot for each cycle. Higher is always better, and a characteristic quality decay is seen in most runs.
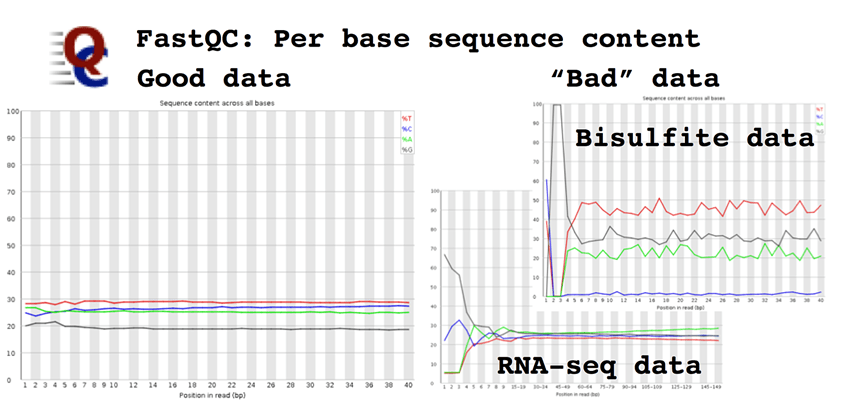
Per base sequence content, which plots the proportion of each base at each cycle. In a random fragment library from a "normal" genome you would expect to see all four bases equally represented. Deviation from normal base content can indicate issues with library quality, but equally some genomes are very GC biased and some NGS applications also introduce a strong GC bias, e.g. Bis-seq.
Sequence quality should be high, generally above Q30, along the length of a good Illumina read. The profile has changed over time; there is a clear decay of read quality towards the end of the read, but read-lengths of 150bp are possible on HiSeq and up to 300bp on MiSeq. The second read in a paired-end run is always slightly lower quality than the first. Low-quality bases can be easily trimmed; lots of low quality bases may indicate a poor library, or problems with phasing. However, a sudden drop in quality is likely to indicate something happened during the run, or that there are short fragments and you are reading into adapter. Tracking the quality profile can identify issues with sequencing chemistry and/or instruments.
The Illumina technology produces the best data when all four bases are equally represented e.g. whole genome sequencing. This is due to several reasons, all of which are to do with the analysis algorithms used to detect and call bases on the sequencer. As you are unlikely to be modifying these the best suggestion is to monitor base composition (FastQC plot), and to understand when it is likely vary because of the library type being sequenced e.g. RNA-seq, Nextera, or bisulfite-converted DNA.
Analyzing NGS QC metrics
Many of the tools or metrics that can be used to QC NGS data are context dependent. The information above should be used as a guide for standard whole genome sequencing samples, and will be different if you are analyzing RNA-seq, bisulfite, amplicon, transposase, ATAC-seq or many other data. If you are unclear about how to interpret data for your application look online at sites like SEQanswers, Compare results from published data or start to collect QC data for your project and learn to interpret it yourself.
It will also be important to consider other QC metrics after alignment and analysis. The more time and effort you spend on QC the better quality your results and conclusion will be.
Find out how one clinical laboratory used our reference material to generate and monitor the quality control metrics in the case study below.